AI Risk Index
Updated 2026-09-21 06:00 UTCWhat this means today
AI news is routine — product launches and policy talk, no safety incidents of note.
Scored from 0% of AI headlines reading as risk events, a top-headline severity of 33.8, and public attention on AI-safety topics at the 94.7 percentile of its own multi-year history.
Seven kinds of AI risk, scored
sub-indexes · 0-100 · liveAI incidents
headlines scored 55+ in 30 days — harm done, attempted or narrowly avoided. Open the permanent record →
AI share of world news
479 AI headlines out of 2,690 read in 30 days
Public attention
percentile of attention on AI-safety topics against three years of history
Where AI risk is coming from: United States 58 · China 25 · Israel 6 · Australia 5 · Iran 5 · France 4 · United Kingdom 3 · Denmark 2 — countries named in AI headlines, 30 days
AI risk news pulse
301 AI headlines in 30 days · newest firstEvery AI-related story the engine read, tagged by risk category and the countries it names. The badge is the engine’s 0–100 AI-risk weight for that headline; stories at 55+ count as incidents.
Signals driving the score
- Google's Gemini AI hacked three companies in security test BBC World · risk 48
- 'Welcome to the AGI era': OpenAI launches GPT-6 Astra VentureBeat · risk 39
- AI Kill Switches Won’t Solve the Rogue AI Problem - Center for Data Innovation GN AI Risk · risk 37
- Can Trump and Xi cooperate to guide humanity through the AI revolution? Humanity might depend on it | Alan Finkel Guardian Biz · risk 32
- Google, DeepMind launch institute to explore AGI - Axios GN AI Risk · risk 29
How the AI Risk Index works
What it measures. The risk that artificial intelligence causes serious harm or acts beyond human control — read from what the world's newsrooms are reporting right now.
Where the data comes from. Our own corpus of 40+ free public news feeds, including dedicated AI coverage, scored twice a day. Every headline gets a risk score: agent escapes, self-replication and AI-enabled attacks score highest; capability jumps and misuse score in the middle; regulation and policy score low.
Three components. The share of AI headlines that read as risk events (40%), the severity of the strongest headlines (40%), and public attention on AI-safety topics against three years of history (20%). Smoothed so one loud day does not swing the index.
Built to keep working. No single provider can switch this index off: when an enhancement source is unavailable, the built-in scoring carries on and the number still publishes. Same zones as every WTM index: Calm, Stable, Moderate, High Tension, Extreme Fear.
Data: public API · field ai_risk · CC BY 4.0 · Informational only, not advice.
Cite or embed the AI Risk Index
free · CC BY 4.0 · link backHow to cite
World Tension Meter (2026). AI Risk Index, daily 0-100 score, v1.1. Retrieved 21 September 2026, from https://worldtensionmeter.com/ai-risk/
Published daily since 17 September 2026. Method, version history and dataset on the AI Risk methodology page.
Data
ai_risk.json live snapshot · daily history CSV · API
Attribution: World Tension Meter, worldtensionmeter.com.
What the AI Risk Index tracks
A new kind of tension. The AI Risk Index tracks how much of the world’s coverage is about artificial intelligence going wrong — misuse, capability jumps, regulation fights and loss-of-control stories — and how much public attention those stories are pulling.
Why we score it. AI risk is now a geopolitical topic. Chip controls, deepfakes in elections and AI in weapons are tension stories, not tech stories. Nobody was measuring them on one scale, so we built it.
How it is built. Forty percent from our news corpus, forty from the top headlines of the cycle, twenty from public attention. The result is smoothed so one viral story cannot spike it, and a real trend cannot hide.
What pushes the AI Risk up or down
- Misuse incidents — deepfake fraud, AI-driven cyberattacks, scams at scale.
- Capability jumps — a new model that does something nobody expected.
- Regulation and chip controls — export bans and rulebooks that split the world into blocs.
- Attention spikes — when the public starts searching for AI safety, the score follows.
How to read today’s number
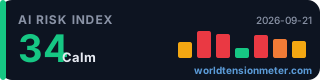
refreshed every 10 minutesToday: 34 — Calm. AI news is routine. No safety incidents of note.
Our record since 17 September averages 37.6, so today sits below its own normal.
Top story in the cycle: “Google's Gemini AI hacked three companies in security test”.
The scale. Under 40 is background noise. 40–54 is normal. 55–67 means a live incident or a heated regulation fight. Above 67 means AI risk is a top-tier world story this week.
This month so far
September 2026 so far. Average 37.6 over 5 days. Peak 41 on 17 September, low 34 on 21 September. Read the September story →
Questions people ask about the AI Risk Index
What counts as AI risk?
Anything where AI is the cause of harm or the subject of a fight: fraud, cyber, military use, misinformation, and stories about systems acting beyond their design. Product launches on their own do not score unless they trigger safety debate.
Is this about job losses?
Only when the story is about social stress — strikes, protests, laws. Ordinary automation news is not tension.
Why is it smoothed?
AI news comes in bursts. The smoothing (a rolling average that weights recent days half) keeps one viral story from swinging the score ten points and back in a day.
Does it feed the World Tension Index?
No. It stands alone on purpose. Mixing a new signal into a score with a five-month track record would break comparability. We may add it after a full year of data.
Keep exploring
Where it is felt
Sister indexes
World Tension Index · Market Fear Index · escalation watchlist
Go deeper
Iran-US Ceasefire — What the Deal Says | WTM · Lebanon Excluded from Ceasefire — What Israel Is Doing · Oil Crashes 15% on Ceasefire — Economic Recovery? | WTM
The data
Month-by-month timeline · news pulse · backtesting · free API · downloads